Explore
Featured
Recent
Articles
Topics
Login
Upload
Featured
Recent
Articles
Topics
Login
Upload
Search Results for 'data median'
data median published presentations and documents on DocSlides.
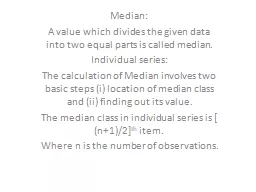
Median: A value which divides the given data into two equal parts is called median.
by walsh
Individual series: . The calculation of Median inv...
Mean, Median, Mode & Range – Demonstration
by walsh
This resource provides animated demonstrations of ...
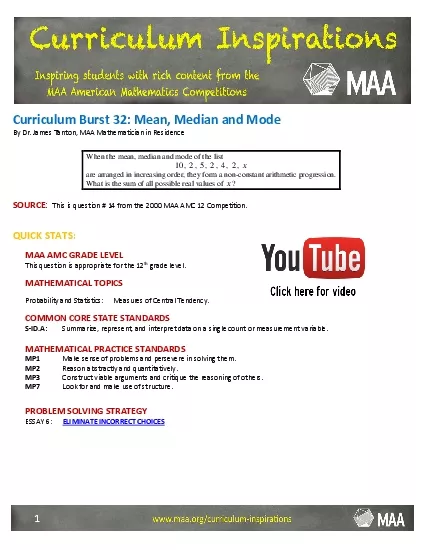
Curriculum Burst 2 Mean Median and ModeBy Dr James TantonMAA Mathemati
by morgan
When the mean median and mode of the list 102524xa...
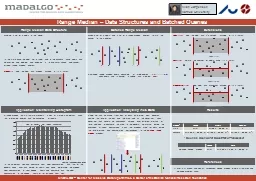
Range Median Data Structure
by trish-goza
Batched. Range Median. Extensions. Maintain a. ...
Social Statistics: Mean, Median, and
by mitsue-stanley
Mode. Statistical analysis involves many mathemat...
For a Set of Data Mean, Median, Mode, and Range
by unita
Mean. Mean cont.. Median. Median cont.. Mode. Rang...
Lesson 6.SP.3 (ALT 1) Mean, Median, Mode, and Range
by unita
Obj. 6.SP.3 . Today we will be learning about . S...
Mean, Median, Mode, And
by trish-goza
Range. ©. Mike’s Math Mall. CCCS Aligned. I me...
Essential Questions • Why is it important to include all data even when the data set has repeatin
by tawny-fly
• What does the median of a box plot tell us ab...
Data Leveraging
by kenai388
BA New York State University at Albany, American H...
Analyzing One-Variable Data
by caitlin
Lesson 1.6. Measuring Center. 1. Find and interpre...
Chapter 4 Displaying & Summarizing Quantitative Data
by alexa-scheidler
Histograms. Similar to bar charts, but with quant...
Box and Whisker Plots A diagram that summarizes data by dividing it into four parts.
by natalia-silvester
It compares two sets of data.. Box and Whisker Pl...
Exploring Data:
by pasty-toler
Frequencies, . Central Tendency, Dispersion and S...
Find Mean, Median, Modal Class from Grouped Data
by kittie-lecroy
16. 8. 9. 4. 0. Example 1.. The number of goals s...
Chapter 1: Exploring Data
by briana-ranney
AP Stats, . 2010-2011. Questionnaire. “Pleas...
Statistics Session 4 Stem and Leaf Displays
by pagi
Summation Notation. Measures of Central Location. ...
2022 AMGA Medical Group
by kylie
Compensation . and Productivity Survey Results. Oc...
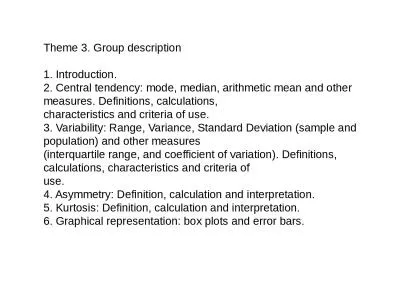
Theme 3. Group description
by sadie
1. Introduction.. 2. Central tendency: mode, media...
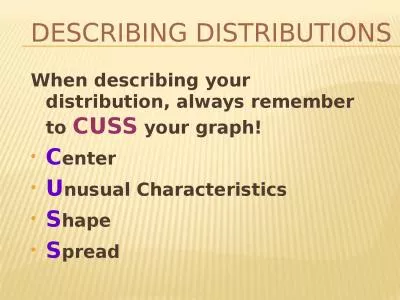
Describing Distributions
by roy
When describing your distribution, always remember...
Chapter 3 Numerical Descriptive Measures
by carny
Group data Vs. Ungrouped data . Statistical...
DNYANSAGAR ARTS AND COMMERCE COLLEGE, BALEWADI, PUNE – 45
by daniella
Subject : Statistics (sub code CA-105 CBCS 20...
Central Tendency in Statics
by DontBeASnitch
by. Dr. Deepali . nigam. Assistant Professor. Depa...
httpwwwfhfagovPolicyProgramsResearchResearchPagesHPITechnicalD
by anya
FHFA index differs from the target of Freddie Macs...
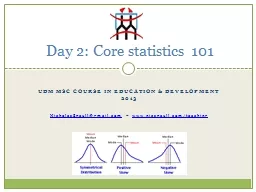
Day 2: Core statistics 101
by botgreat
2013. NicholasSpaull@gmail.com. – . www.nicspau...
Bell Ringer
by jubilantbikers
What is a median?. What is a mode?. Mean, Median, ...
Lesson 1 Intro, NOTES/examples, classwork, discussion
by heartersh
Module 2: Descriptive Statistics. Statistics is al...
CHAPTER 2 : Describing Distributions with Numbers
by jane-oiler
CHAPTER 2 : Describing Distributions with Number...
Lecture 3 End of lecture 2
by yoshiko-marsland
Lecture 3 End of lecture 2 + Displaying quantitat...
Descriptive Statistics Part I Each slide has its own narration in an audio file.
by min-jolicoeur
Descriptive Statistics Part I Each slide has its...
John Loucks St . Edward’s
by lois-ondreau
University. .. .. .. .. .. .. .. .. .. .. .. SLID...
11.1 Measures of Center and Variation
by lois-ondreau
What We Will Learn. Compare mean, median, and mod...
Averages Mathematics for
by ellena-manuel
GCSE . Science. This presentation covers these Ma...
Chapter 1: Looking at Data —
by kittie-lecroy
Distributions. Lecture Presentation Slides. Macmi...
Measures of Center and Spread
by lindy-dunigan
Comparing and Contrasting Data Sets. Bellwork. Nu...
Regression and Median-Fit Lines (4-6)
by ellena-manuel
Objective: Write equations of best-fit lines usi...
Warm Up! Write down objective and homework in agenda
by ellena-manuel
Lay out homework (none!!). Homework (Box Plot . w...
2. Numerical descriptors
by jane-oiler
The Practice of Statistics in the Life Sciences. ...
Descriptive
by sherrill-nordquist
Statistics. Measures of Central Tendency. Measure...
How to describe a graph
by lois-ondreau
Otherwise called. CUSS. 1. Center. discuss where ...
Load More...